
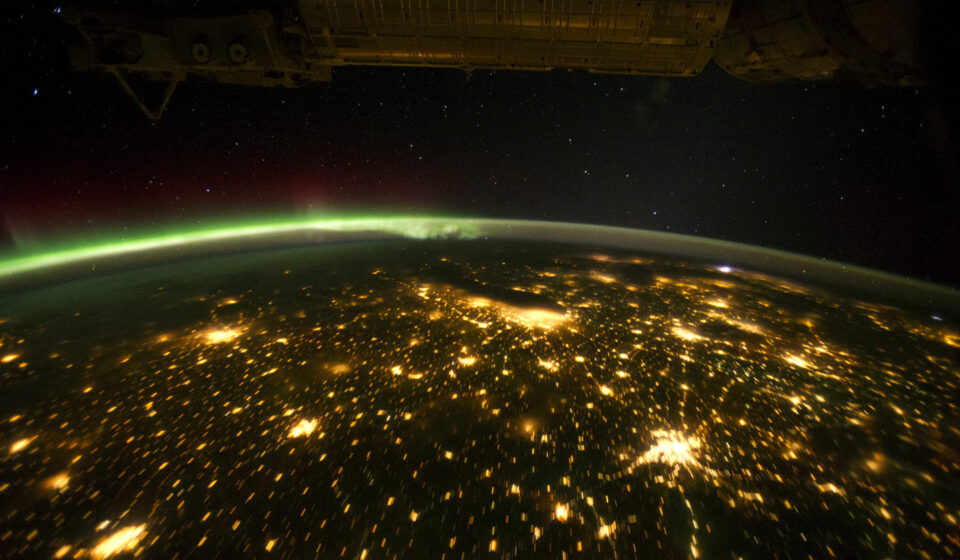
Illuminating the Dark: The Comprehensive Guide to NASA City Lights and Nighttime Remote Sensing

For decades, humanity has looked up at the stars to understand our place in the universe. However, an equally profound revelation occurs when we turn our scientific instruments back toward the Earth after the sun goes down. The glowing grids of urban environments, the flickering lights of fishing fleets at sea, and the sudden darkness induced by natural disasters all tell a complex story of human civilization. The collection of global nighttime imagery, widely recognized as NASA City Lights, has evolved from a series of striking visual curiosities into one of the most critical datasets in modern Earth science. By capturing the artificial radiance emitted by human infrastructure, these observations provide a unique, real-time reflection of human activity, energy consumption, and socioeconomic development across the globe.
As urbanization accelerates and global power grids expand, understanding the footprint of human activity becomes increasingly vital for policymakers, ecologists, and economists alike. The primary engine behind these modern visualizations is NASA’s Black Marble project, a specialized product suite designed to strip away atmospheric distortions, moonlight reflections, and cloud cover to isolate the true light signals of human civilization. Through advanced satellite instrumentation and sophisticated calibration algorithms, NASA City Lights data allows researchers to map the growth of megacities, assess damage from extreme weather events, track the progress of rural electrification, and monitor the environmental degradation caused by light pollution. This comprehensive guide explores the history, technology, applications, and future of mapping our planet’s nocturnal luminescence.
The Genesis of NASA City Lights and Satellite Nighttime Imaging
The scientific endeavor to capture the Earth’s nocturnal glow began long before the creation of the ultra-high-definition composites available today. The earliest systemic efforts to observe the planet’s nighttime landscape date back to the 1970s with the U.S. Air Force’s Defense Meteorological Satellite Program (DMSP) Operational Linescan System (OLS) (Elvidge et al., 2022). While the OLS sensor was initially engineered to detect clouds at night using reflected moonlight to aid military operations, scientists quickly realized that the sensor’s highly sensitive low-light capabilities were picking up the unmistakable glow of cities, towns, and industrial gas flares (Elvidge et al., 2022). These early images provided the first global look at human geography defined not by political borders, but by the physical deployment of electricity.
Despite the groundbreaking nature of the DMSP-OLS data, it possessed significant technological limitations that restricted its utility for quantitative scientific research. The sensor featured a low spatial resolution of roughly one kilometer and a restrictive 6-bit radiometric resolution, meaning it could only distinguish between 64 distinct shades of gray (Fikriyah et al., 2023). This low radiometric range caused the cores of major metropolitan areas to become completely saturated, appearing as solid white blobs without any internal variation or structural detail. Furthermore, the lack of onboard calibration made it extremely difficult for scientists to accurately compare light intensity across different periods or distinct geographic regions, limiting its application largely to qualitative mapping and visual illustrations.
The true paradigm shift in nighttime remote sensing occurred with the launch of the Suomi National Polar-orbiting Partnership (Suomi NPP) satellite, carrying the Visible Infrared Imaging Radiometer Suite (VIIRS) sensor. VIIRS introduced the Day/Night Band (DNB), a revolutionary panchromatic band specifically optimized for low-light imaging. Unlike its predecessor, the VIIRS DNB operates with a 14-bit radiometric resolution, allowing it to capture over 16,384 levels of gray and preventing the severe pixel saturation that plagued early NASA City Lights imagery (Fikriyah et al., 2023). Combined with a vastly improved spatial resolution of 500 meters, this technological leap allowed scientists to peek into the internal structures of cities, separating commercial districts from residential zones and establishing a reliable baseline for quantitative global research.
Understanding the Technology Behind NASA’s Black Marble Project
The stunning imagery that the public recognizes as NASA City Lights is not a simple snapshot taken from orbit. In reality, a raw satellite image captured at night is an incredibly noisy composition of various light sources, many of which have nothing to do with human activity. On any given night, the sensor records a complex mixture of direct artificial light, light reflected off clouds, seasonal snow cover, atmospheric haze, aurora borealis, and fluctuating levels of moonlight (Zhang et al., 2023). To isolate the anthropogenic light emitted by street lamps, homes, and factories, NASA developed the Black Marble product suite (VNP46), a cutting-edge data pipeline led by scientists at the Goddard Space Flight Center (Román et al., 2018).
The core mission of the Black Marble project is to deliver daily, cloud-free nighttime light data that has been rigorously corrected for environmental noise. To achieve this, the Black Marble algorithms utilize a sophisticated mathematical framework to calculate and subtract the effects of the lunar cycle. Because moonlight can be up to 400,000 times dimmer than sunlight, yet still bright enough to distort artificial light readings, the algorithm applies a lunar Bidirectional Reflectance Distribution Function (BRDF) to precisely model how much moonlight is reflecting off the Earth’s surface at any specific angle on any given night (Fikriyah et al., 2023). This allows the system to artificially “turn off” the moon in the data, ensuring that changes in brightness reflect actual shifts in human electricity usage rather than the phases of the lunar cycle.
In addition to lunar corrections, the Black Marble pipeline incorporates advanced atmospheric and terrain corrections. It filters out the scattering effects of aerosols, dust, and water vapor, while also accounting for the obstructing effects of complex topography, such as mountain ranges or deep urban canyons. When a pixel is obscured by heavy cloud cover, the system draws upon a temporal compositing process, analyzing a sequence of multi-temporal observations over a given month or year to select the clearest, highest-quality data points for that location (Fikriyah et al., 2023). The resulting data product provides a continuous, highly accurate, and mathematically standardized record of global artificial radiance that allows for precise, multi-temporal scientific comparisons across weeks, months, or years.
Processing and Calibrating NASA City Lights Data
To transform raw satellite signals into a standardized scientific asset, NASA City Lights data undergoes intense calibration procedures to resolve inherent geometric and radiometric anomalies. One of the primary obstacles in daily nighttime light time-series analysis is the “angular effect” caused by varying satellite viewing angles. Because the satellite orbits the Earth in a sun-synchronous path, it does not look down at a city from the exact same angle every night. Depending on whether the satellite views a city from a straight-down nadir perspective or an off-nadir slanted angle, the observed brightness can change dramatically because tall buildings, trees, and urban infrastructure block or reflect light differently depending on the viewpoint.
Recent scientific frameworks have targeted these angular inconsistencies to improve the temporal stability of daily datasets. For instance, advanced models have been developed to mitigate spatial mismatches and minimize the rhythmic fluctuations caused by changing observation angles across hundreds of major global cities. This calibration involves cross-referencing satellite observations with ground-truth data and executing complex spatiotemporal interpolations to fill data gaps caused by persistent cloud cover or atmospheric artifacts. By standardizing these viewing geometry variables, researchers can confidently attribute short-term changes in light intensity to real-world ground events, such as power grid fluctuations or seasonal economic shifts, rather than sensor positioning errors.
Furthermore, the data processing chain must account for stray light contamination and instrument degradation over time. The VIIRS sensor experiences intense solar glare when transitioning between the day and night sides of the Earth, which can leak into the dark-side collections and corrupt data along specific orbital swaths (Elvidge et al., 2022). Radiometric calibration algorithms continually monitor these anomalies and apply corrective masks to ensure data integrity. The final output of this strenuous process is a suite of highly stable data products, such as the daily VNP46A2, which provides the global scientific community with a reliable, standardized metric of nocturnal radiance to measure everything from economic health to post-disaster recovery.
Monitoring Urbanization and Global Economic Dynamics
One of the most powerful and widespread applications of NASA City Lights data is its utilization as a proxy indicator for human settlement expansion and macroeconomic activity. Traditional socioeconomic indicators, such as Gross Domestic Product (GDP), population density, and industrial output, are often difficult to collect in real-time, particularly in developing nations or regions with weak statistical infrastructures. Because the installation and maintenance of outdoor electric lighting are directly tied to built infrastructure and capital investment, the spatial distribution and intensity of artificial light sources provide a direct, objective measurement of human footprint and regional economic development (Bará & Falchi, 2023; Zhao et al., 2019).
By analyzing multi-temporal Black Marble annual composites, urban planners and geographers can precisely map the borders of expanding urban areas and identify the emergence of sprawling megacities. The bright pixels within the dataset act as an exceptional tool for identifying built-up areas, achieving high mapping accuracies when cross-referenced with traditional secondary land cover maps (Fikriyah et al., 2023). This capability is incredibly valuable for studying urban dynamics in the Global South, where rapid, informal urban growth often outpaces formal census surveys. The data allows researchers to observe how cities merge along transportation corridors, forming massive, interconnected economic regions that demand new approaches to regional resource management and infrastructure planning.
Beyond simple physical mapping, the specific radiance values captured by NASA City Lights have shown a strong statistical correlation with regional GDP and energy consumption dynamics (Zhao et al., 2019). When a region undergoes economic expansion, the commercial lighting of new factories, the streetlights of newly paved roads, and the residential lighting of wealthier neighborhoods collectively drive up the area’s nocturnal radiance. Conversely, economic stagnation, industrial decline, or geopolitical conflicts manifest as a measurable dimming of city lights. Economists frequently use this data to independently verify official government economic reporting, analyze localized wealth disparities within countries, and track the real-time economic consequences of international trade policies or banking crises.
The Critical Role of NASA City Lights in Disaster Reconnaissance and Recovery
When natural disasters strike, rapid and accurate situational awareness is vital for coordinate lifesaving humanitarian responses and emergency relief efforts. Traditional daytime satellite imagery can be severely limited by weather patterns, and assessing ground-level infrastructure damage over thousands of square miles can take days or weeks. NASA City Lights data, particularly when processed through the daily Black Marble pipeline, provides an invaluable solution by allowing emergency management agencies to monitor power grid failures and structural damage in near-real-time by tracking where the lights have suddenly gone out (Zhang et al., 2023).
The unique value of the daily Black Marble product during a crisis lies in its extensive atmospheric corrections. Because it actively filters out cloud contamination and adjusts for moonlight fluctuations, it provides an authentic look at power outages even when a region is experiencing heavy post-storm cloud cover (Zhang et al., 2023). When a hurricane, tornado, or earthquake impacts a populated area, scientists can compare the post-disaster nighttime radiance against a baseline of pre-disaster light levels. The degree of light reduction serves as a direct indicator of damage severity, allowing first responders to pinpoint the exact neighborhoods, hospitals, and critical infrastructure networks that have lost electrical power and require immediate aid (Zhang et al., 2023).
| Disaster Type | Nighttime Light (NTL) Pattern | Primary Utility in Emergency Management |
| Hurricanes / Cyclones | Follows a distinct “resilience curve” with sharp drops followed by gradual, uneven spatial recovery. | Maps widespread power outages, evaluates grid resilience, and identifies slow-recovery communities. |
| Earthquakes | Abrupt, highly localized light loss corresponding to structural collapse and immediate grid failures. | Identifies epicenter impact zones and guides search-and-rescue teams to heavily damaged urban sectors. |
| Tornadoes | Narrow, linear paths of complete light obliteration cutting through broader urban or rural grids. | Tracks the precise path of destruction and quantifies localized neighborhood-level housing damage. |
Furthermore, the utility of NASA City Lights extends far beyond the immediate aftermath of an event. By continuously tracking the return of light over weeks and months, researchers can chart a community’s long-term disaster recovery trajectory. The recovery of light patterns over time often maps onto a classic “resilience curve,” revealing deeper systemic inequalities in how quickly different communities are able to rebuild (Zhang et al., 2023). For example, wealthier commercial districts or high-priority grid sectors typically experience rapid light restoration, while lower-income residential areas or marginalized rural communities may remain dark for extended periods, highlighting critical gaps in municipal resource allocation and infrastructure equity.
Mapping Global Access to Electricity and Energy Transitions
Ensuring access to affordable, reliable, sustainable, and modern energy for all is a core component of global development goals. However, traditional methods for monitoring electrification rely heavily on self-reported national surveys that are infrequently updated and often fail to capture the true reliability of the power supply. NASA City Lights data provides an objective, independent platform to map the gaps in the global electrical infrastructure, helping international organizations identify un-electrified rural populations and assess the equity of urban energy distribution.
While low-resolution satellites like Suomi NPP are excellent for regional overviews, researchers are increasingly combining NASA City Lights data with high-resolution astronaut photography captured from the International Space Station (ISS) to study intra-urban electrification patterns. ISS photography, taken with digital single-lens reflex (DSLR) cameras, offers sharp spatial resolutions that allow scientists to evaluate individual neighborhoods and informal settlements (or slums) within major cities. While a formal neighborhood may blaze with bright, consistent street lighting, an adjacent informal settlement might appear entirely dark in satellite imagery, exposing a stark visual narrative of energy poverty and infrastructural exclusion.
In addition to mapping the presence of electricity, nighttime remote sensing is becoming crucial for tracking global energy transitions and changes in lighting technology. As municipalities worldwide replace aging, inefficient high-intensity discharge (HID) streetlights with energy-efficient Light Emitting Diode (LED) systems, the spectral signature of cities shifts dramatically. Because the standard VIIRS DNB sensor is panchromatic and largely blind to blue light emissions, this shift can sometimes cause cities transitioning to LEDs to appear erroneously dimmer in standard NASA data. To resolve this, scientists are leveraging hyperspectral instruments like the DLR Earth Sensing Imaging Spectrometer (DESIS) onboard the ISS, which can isolate narrow atomic emission lines to identify the exact types of bulb technologies used across a city, helping urban planners track energy efficiency improvements and manage municipal carbon footprints.
Measuring the Ecological and Environmental Impacts of Light Pollution
While the expansion of artificial lighting is an undeniable marker of human technological progress, it also carries a significant environmental cost. The widespread proliferation of artificial light at night (ALAN) has radically transformed the Earth’s nocturnal environment, creating a global phenomenon known as light pollution. NASA City Lights data has become the primary global resource for ecologists and environmental scientists seeking to quantify the spread of this pollution and understand its disruptive effects on natural ecosystems, wildlife behavior, and human health (Bará & Falchi, 2023).
The ecological consequences of light pollution are vast and deeply disruptive. Many animal species rely heavily on evolutionary cues tied to natural darkness and cycles of moonlight to navigate, forage, reproduce, and avoid predators. Artificial light emissions create massive “blurred” zones of skyglow that propagate through the atmosphere over hundreds of miles, fracturing natural dark corridors and encroaching directly into protected wilderness sanctuaries and national parks (Bará & Falchi, 2023). For instance, sea turtle hatchlings, which rely on the natural horizon light over the ocean to guide them safely from the beach to the water, are frequently disoriented by the competing glare of coastal city lights, leading them inland toward roads and predators. Similarly, migratory birds navigating by starlight are often drawn off-course by brightly lit skyscrapers, resulting in fatal collisions.
“The temporal dynamics of light pollution show a characteristic multiscale behavior… with an estimated increase of the radiance in the visible spectrum of order 270%–400% during the same period in… suggesting actual increases in the range of 7%–10% per year” (Bará & Falchi, 2023).
This alarming rate of expansion means that pristine night skies are rapidly disappearing. For humans, prolonged exposure to artificial light at night disrupts natural circadian rhythms by suppressing the production of melatonin, a hormone critical for regulating sleep cycles and maintaining immune system health. By utilizing NASA City Lights data to model artificial sky brightness, public health researchers and urban planners can collaborate to design smarter, targeted lighting ordinances. These initiatives promote the installation of shielded light fixtures that direct light strictly downward, minimize blue-light emissions, and establish dedicated dark-sky reserves to safeguard both human well-being and local biodiversity.
The Future of Nighttime Remote Sensing: Advancements Beyond Panchromatic Data
As we look toward the future, the field of nighttime remote sensing is poised for another monumental transformation. While the VIIRS Day/Night Band continues to serve as an exceptional workhorse for global monitoring, its single panchromatic band and 500-meter pixel size limit its ability to answer more nuanced questions about urban composition, specific lighting sources, and localized environmental impacts. To break through these limitations, NASA and the broader scientific community are actively developing next-generation imaging technologies that offer higher spatial, spectral, and temporal resolutions.
One of the most promising frontiers involves the integration of spaceborne hyperspectral sensors to extract detailed spectral information from nighttime lights. Instruments like DESIS on the International Space Station have successfully demonstrated the ability to accurately identify narrow atomic emission lines, allowing researchers to differentiate between various lighting types—such as high-pressure sodium, metal halide, and different color temperatures of LEDs—from orbit. This capability opens up groundbreaking applications in urban energy auditing, allowing scientists to monitor a city’s green energy compliance and track carbon emissions at a neighborhood scale.
Furthermore, future satellite missions aim to improve the temporal resolution of nighttime imaging by deploying constellations of small satellites (smallsats) capable of capturing multiple observations throughout a single night. Current platforms only provide a single midnight or pre-dawn snapshot, missing the highly dynamic changes in human activity that occur during evening rush hours or major cultural events. By capturing a continuous stream of nighttime data, future iterations of NASA City Lights will enable real-time traffic flow monitoring, immediate grid strain analysis during heatwaves, and unprecedented precision in emergency disaster reconnaissance, ensuring that our view of the world after dark remains a vital pillar of global Earth science.
Frequently Asked Questions (FAQs)
What exactly is the NASA Black Marble project?
The NASA Black Marble project is a specialized product suite derived from the Visible Infrared Imaging Radiometer Suite (VIIRS) sensor onboard the Suomi NPP satellite. It utilizes advanced algorithms to remove clouds, moonlight reflections, atmospheric haze, and terrain distortions from raw nighttime imagery. This process isolates clean, standardized, and quantitative artificial light data, allowing scientists to track human activity and environmental changes accurately over time.
How often are NASA City Lights images updated?
While the famous, highly publicized global “NASA City Lights” maps are massive composites released every few years to showcase long-term global changes, the underlying scientific data products (like Black Marble) are processed and updated on a daily basis. This daily frequency allows researchers to use the data for near-real-time operations, such as monitoring active disaster zones, power grid failures, and short-term economic disruptions.
Can NASA City Lights distinguish between different types of light bulbs?
Standard panchromatic sensors, like the VIIRS Day/Night Band used for most NASA City Lights products, cannot distinguish between light types because they group all visible light into a single broad channel. However, researchers are now using newer, specialized hyperspectral instruments (such as the DESIS instrument on the International Space Station) to read the unique spectral signatures of individual light sources, making it possible to identify transitions from older sodium bulbs to modern energy-efficient LEDs.
Why do some developed or growing areas sometimes look dimmer in newer NASA images?
This phenomenon is often a byproduct of the global transition to energy-efficient LED lighting. Older streetlights emitted a broad amber glow easily captured by satellite sensors. Modern LEDs are highly directional, focusing their light straight down toward the pavement rather than scattering it horizontally or upward into space. Additionally, because the VIIRS DNB sensor has limited sensitivity to blue light, a city that switches to cool-toned LEDs may appear falsely dimmer in the dataset, a factor that scientists adjust for using auxiliary spectral data.
How is NASA City Lights data used to fight climate change?
NASA City Lights data assists in the fight against climate change by providing an independent, objective measurement of human energy consumption and urbanization. By analyzing the intensity of light emissions, scientists can cross-reference the data with population statistics to create high-resolution maps of fossil fuel carbon dioxide ($CO_2$) emissions. It also helps track municipal energy efficiency upgrades and quantifies the expanding footprint of urban sprawl to promote more sustainable urban planning.